By: Dan Gunter & Marc Seitz
Motivation
Problem:
On a recent threat hunt, we found ourselves in a position out in the field at a place with limited internet bandwidth and only our laptops for approved hardware resources for data. One of the datasets supplied for the engagement comprised of 5-6 GB of Windows Event Logs stored as .evtx files. There are several tools out there for streaming Windows Event Logs to a destination, but we were limited to offline use of this dataset. We needed a way to sort through and run analytics across the information in an efficient and swift manner. Due to the size of the collection, we immediately ruled out manual analysis of the Windows Event Logs.
Solution:
Ultimately, we wrote a Python module named EvtxToElk. This module does what the name implies: ingests evtx files into an ELK stack. In our scenario, we ingested Windows Event Logs evtx files into a fresh ELK stack running locally, making analysis efficient and effective. Today we are open-sourcing this Python module to add another tool into the broader information security community toolbox to find attackers.
Python package information: https://pypi.org/project/evtxtoelk/
Source code: https://github.com/dgunter/evtxtoelk
Design
Before today, there was no module taking evtx files the full distance from file to indexed in the ELK stack. However, in true Python nature, we harnessed the capabilities of three different Python modules and added additional logic to create the output we required.
- Willi Ballenthin (@williballenthin) previously wrote an excellent Python module named python-evtx.
- Function used: Creates XML files from Windows Event Log files stored as evtx files
- Martin Blech wrote a module named xmltodict
- Function used: transforms xml file to dict
- ElasticSearch Module
- Function used: importing JSON files into ELK stack
Instead of re-inventing the wheel, we took the output of Willi Ballenthin’s tool and converted the XML to a Python dictionary. The ElasticSearch module requires changing the dictionary into a JSON string. Our module combines all three modules and adds the needed data normalization between module output for data records to then be loaded into ELK using the ElasticSearch module. Some logic did have to be written to get the dictionary data into an ELK-friendly format. If you look at the source code, most lines of code involved restructuring the JSON data to meet ELK storage constraints.
WINDOWS EVENT LOG FORMAT PROGRESSION

Start to Finish
Step 0: Create an ElasticSearch and Kibana Instance
We ended up using a Docker container by running the following command:
- docker run -p 9200:9200 -p 9300:9300 -p 5601:5601 sebp/elk
The command above will run Sébastien Pujadas’s (spujadas) ELK Docker container from the Docker Hub that includes Elasticsearch, Logstash, and Kibana. Docker run will download the ELK image if you haven’t previously done so. You can confirm that the ELK stack is running by visiting:
- http://localhost:5601
Step 1: Install EvtxToElk Python Module
The Python Package Index (PyPi) hosts the EvtxToElk package. To download with PIP, use the following command:
- python3 -m pip install evtxtoelk
You can also use:
- pip install evtxtoelk
Step 2: Load Windows Event Logs into ELK
Loading an event log is as simple as opening the Python interpreter and running these two lines of Python code:
- from evtxtoelk import EvtxToElk
EvtxToElk.evtx_to_elk(“Security.evtx”,”http://localhost:9200″)
The first parameter is the path to the event log file you want to load and the second is the connection string to the Kibana instance you are using. We used the security.evtx file from JPCERTCC’s LogonTracer github repo here:
Step 3: Configure Kibana Index
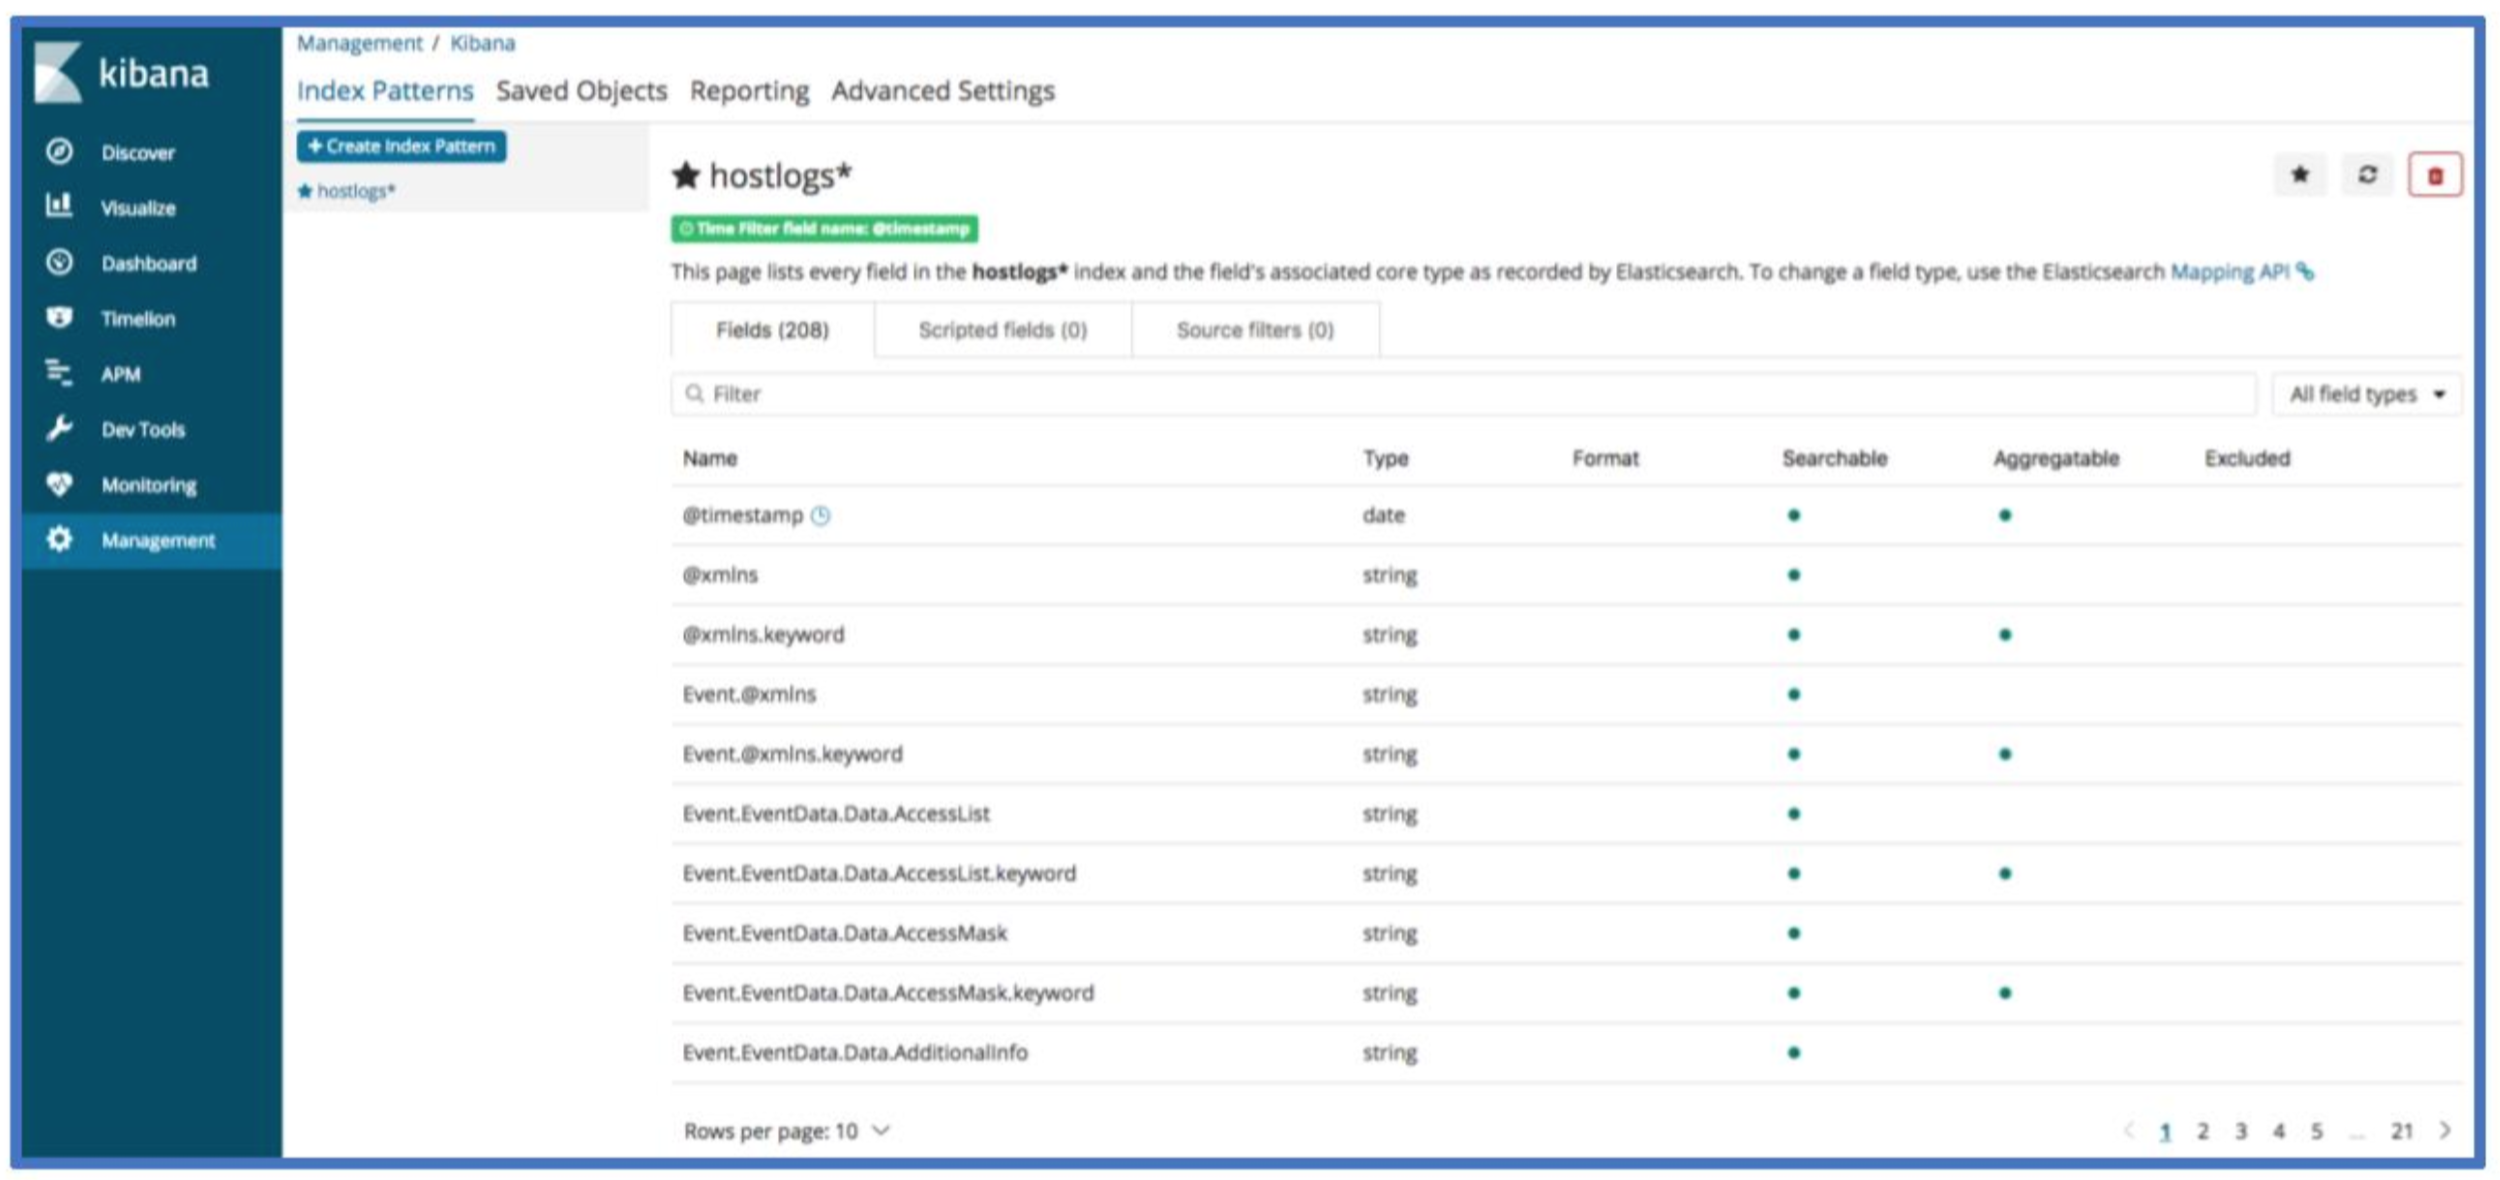
If you’ve completed the steps successfully up to this point, you should now have log data in your Kibana instance. To view data in Kibana, you will need to set up an index pattern. Currently, all data saves into an index named hostlog and a doc_type named hostlog. The index will be configurable in an upcoming version. In the index pattern field, you should use hostlog*.


Now select @timestamp for the time filter field name and click create index pattern.
Your Kibana index screen should now look something like the image below.

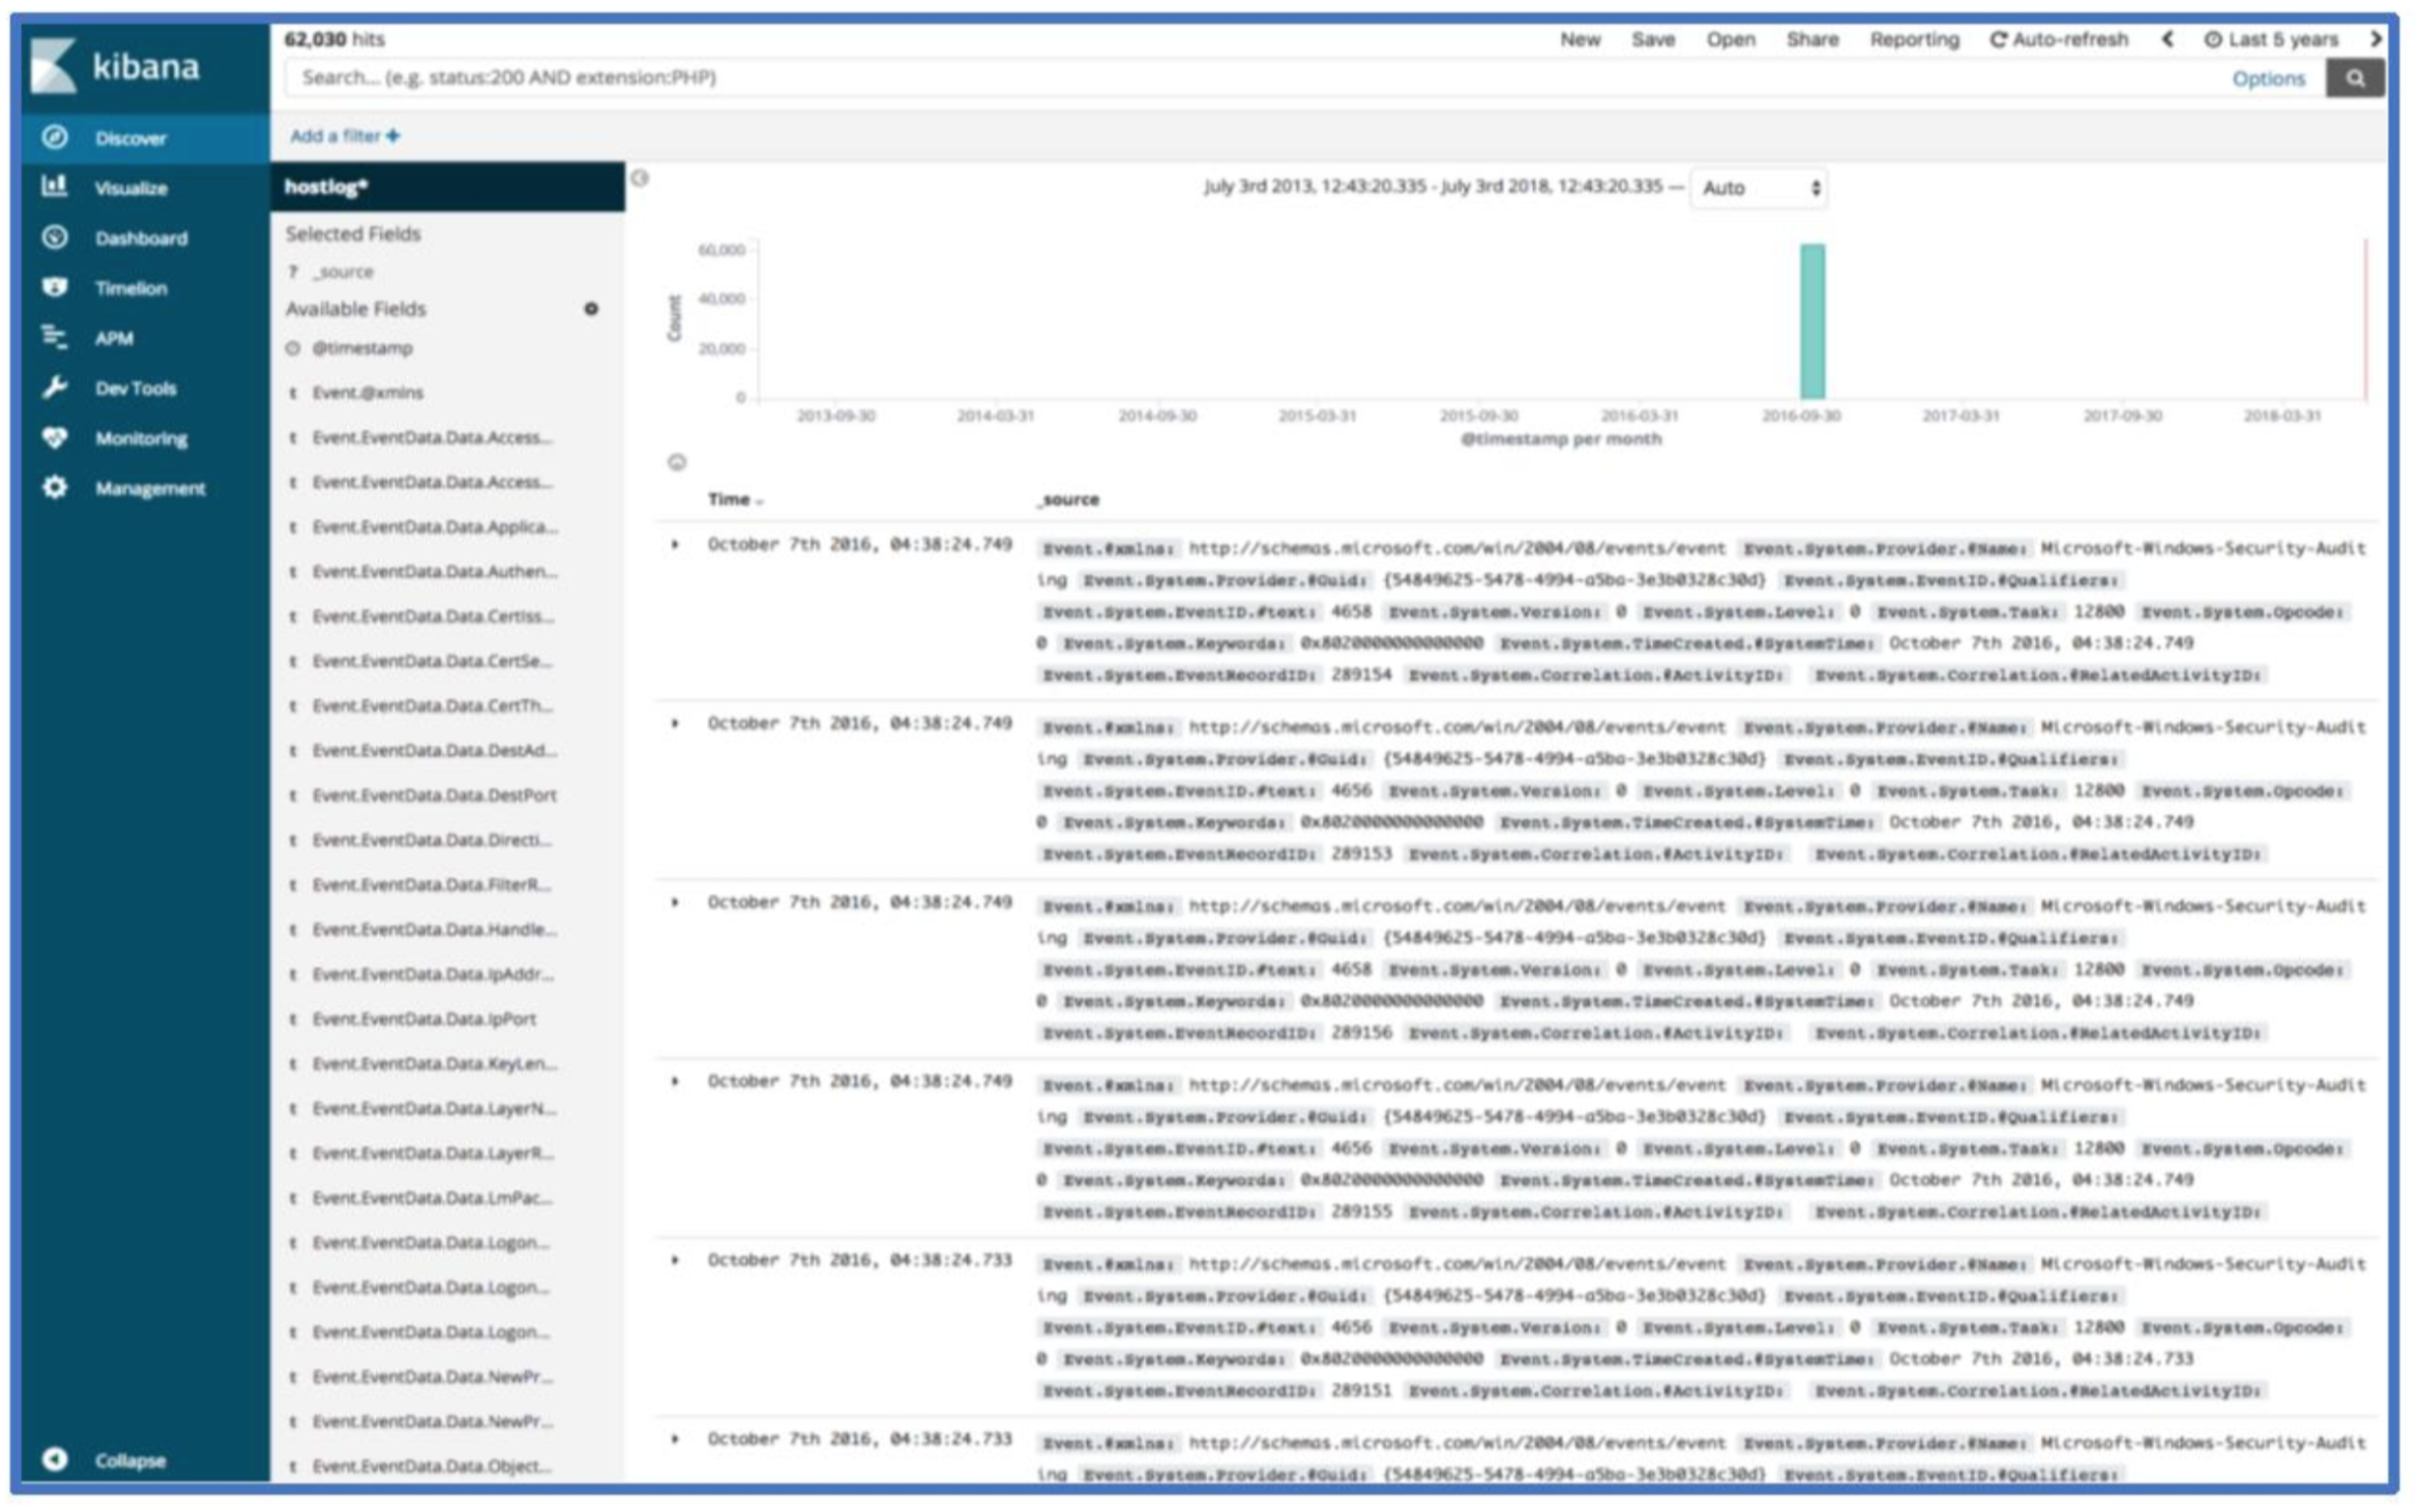
Step 4: Confirm Presence of Data
You should now be able to view host log data with the discover page. If you are not seeing any data, check that the time range in the top right corner of Kibana includes the time range you expect to see data in.

Moving Forward
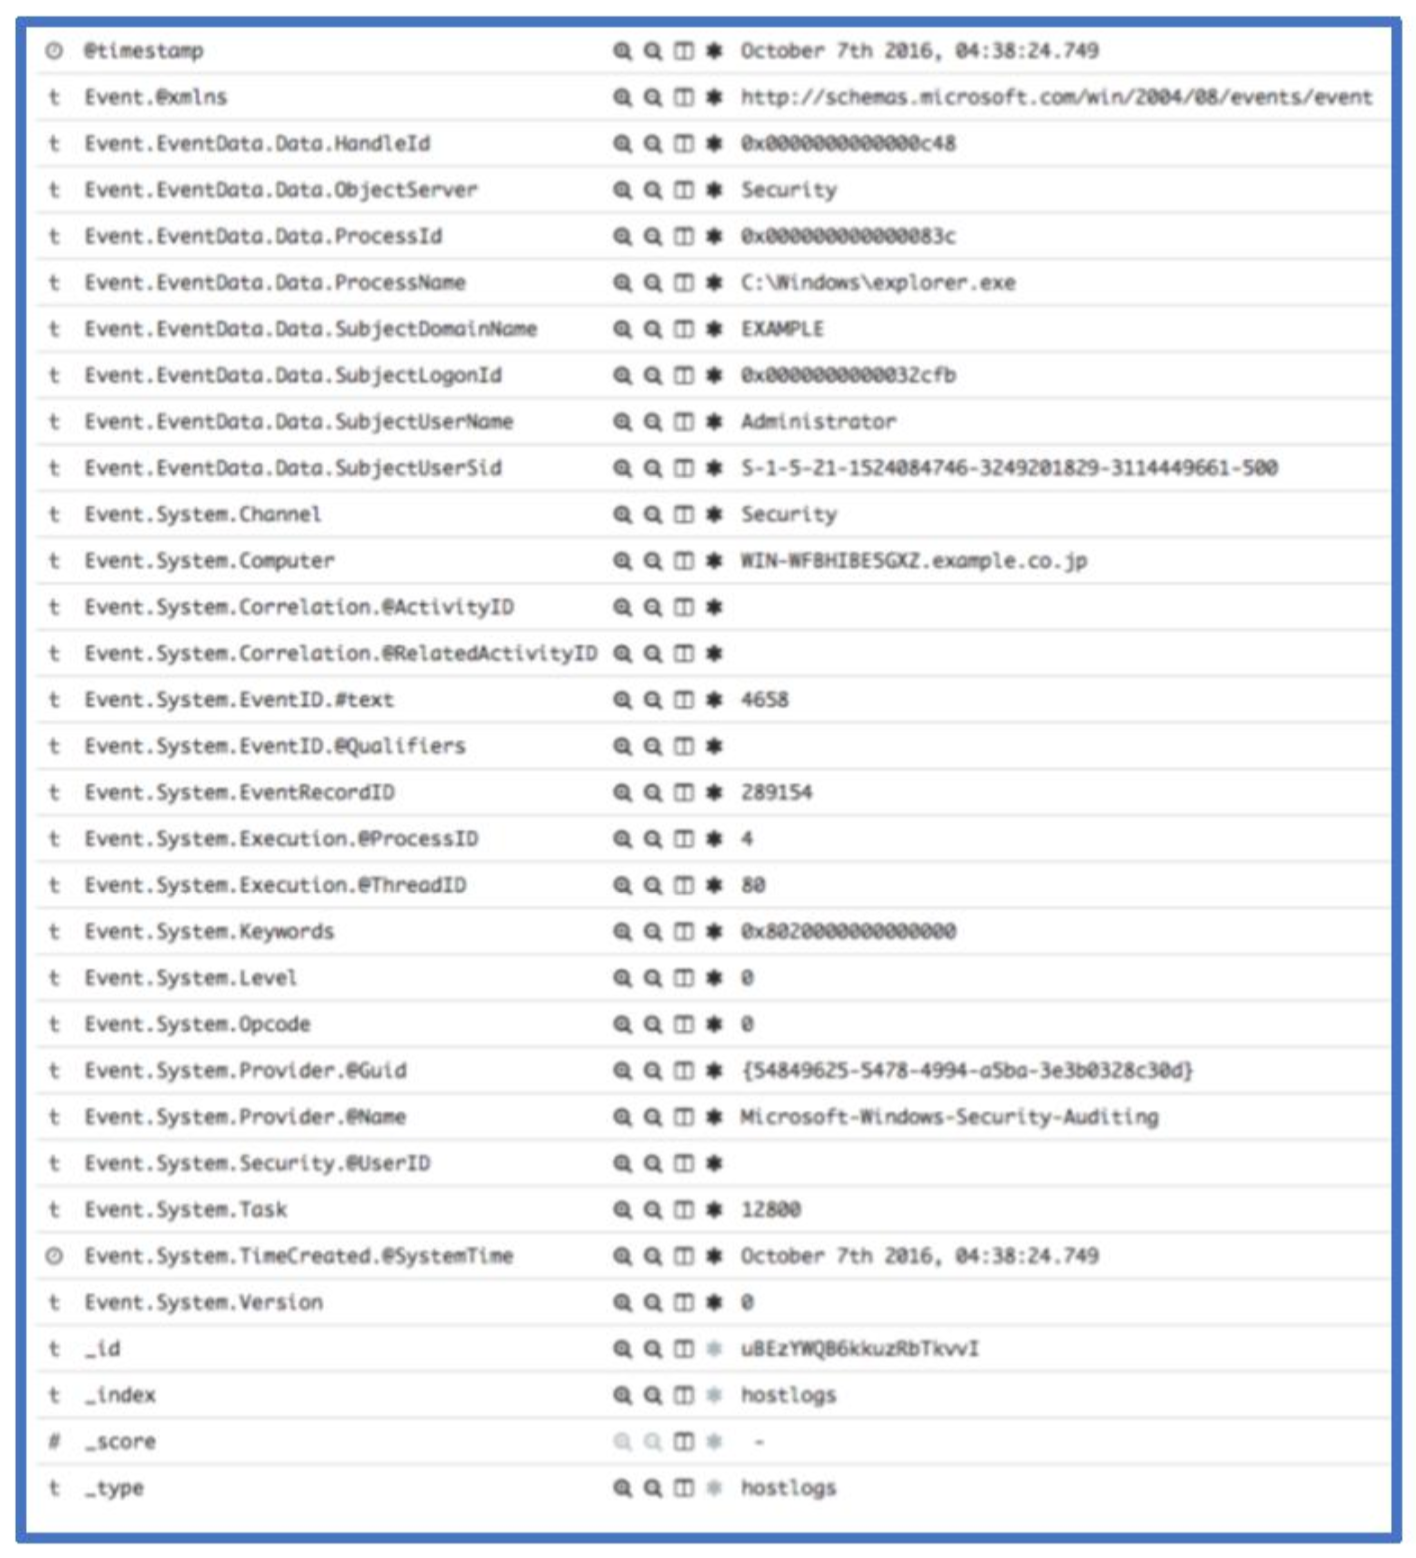
Congrats! You’ve now loaded Windows Event Log data into ELK! A lot of the threat hunts and incident response cases we’ve worked lately relied on the above approach and use of Kibana’s visualization features. Here’s an overview of a few fields to get started. The screenshot below shows the first record.

The Event.System.EventID.#text field is the event ID associated with a given record. Event 4658 shown above logs a handle to an object being closed. We can see the owning process, owning user and domain as well as other system information associated with this event. If you need a reference for a given windows event record, we recommend Randy Smith’s Ultimate Windows Security site. For this event, the relevant page is: https://www.ultimatewindowssecurity.com/securitylog/encyclopedia/event.aspx?eventid=4658.
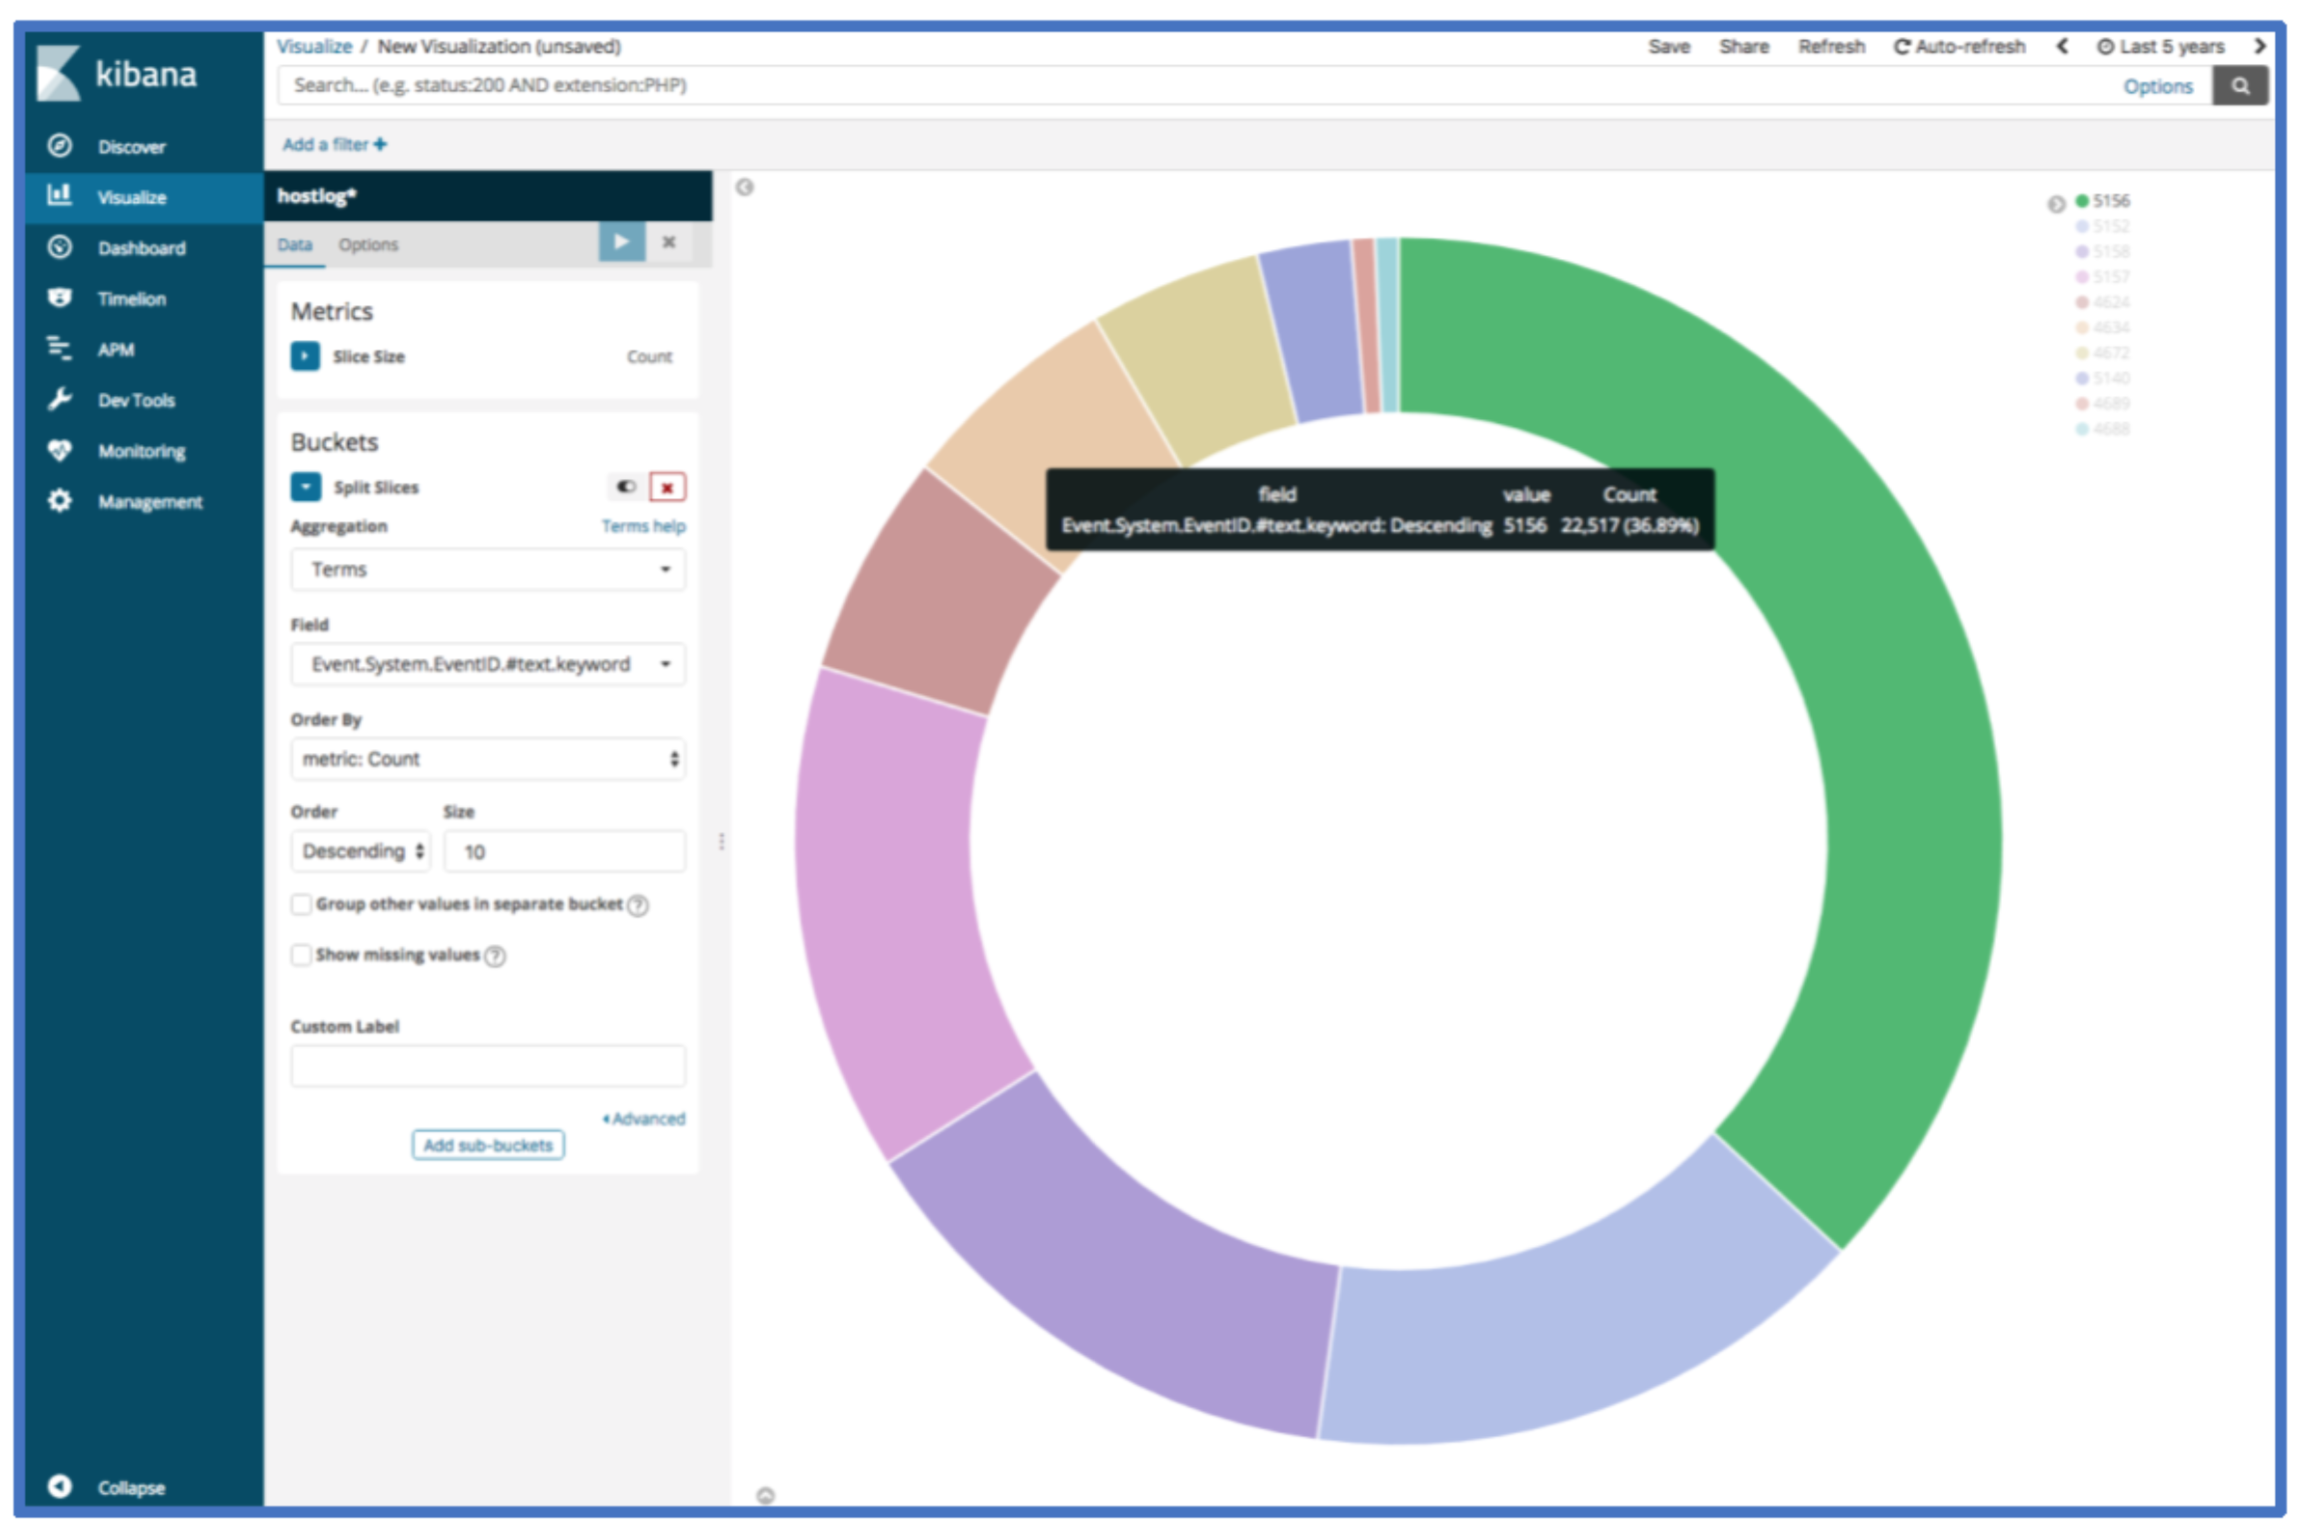
If we wanted to see what the top 10 event log IDs within the loaded event logs are, we can use the following visualization. The count can be viewed by hovering over one of the segments of the pie chart.

When we start a threat hunt with new data sets, we often use a set of saved queries and visualizations to provide a quick glance into commonly analyzed areas. The initial glance offers an initial assessment of where to allocate during a new engagement. The saved queries and visualizations also allow analysis across large sets of data and the ability to use Jupyter Notebooks to search across the data.
Conclusion
EvtxToElk takes previously-captured Windows Event Logs and runs the data through all formatting and normalization required to be indexed in ELK. The ability to work with Windows Event Logs in ELK greatly increases efficiency of analysis and cannot be overstated. Of course, this is just one way to solve a problem we encountered. Let us know if there are other modules you would like to see!
Hopefully, this helps get analysis rolling. Feel free to reach out to us on Twitter (@Dan_Gunter, @SubtleThreat) if you have any questions, ideas or comments.
Ready to put your insights into action?
Take the next steps and contact our team today.